Inactivity
States with the Most Inactive Adults
#1 = most inactive
- Period
- 2024
- Last updated
What the data shows
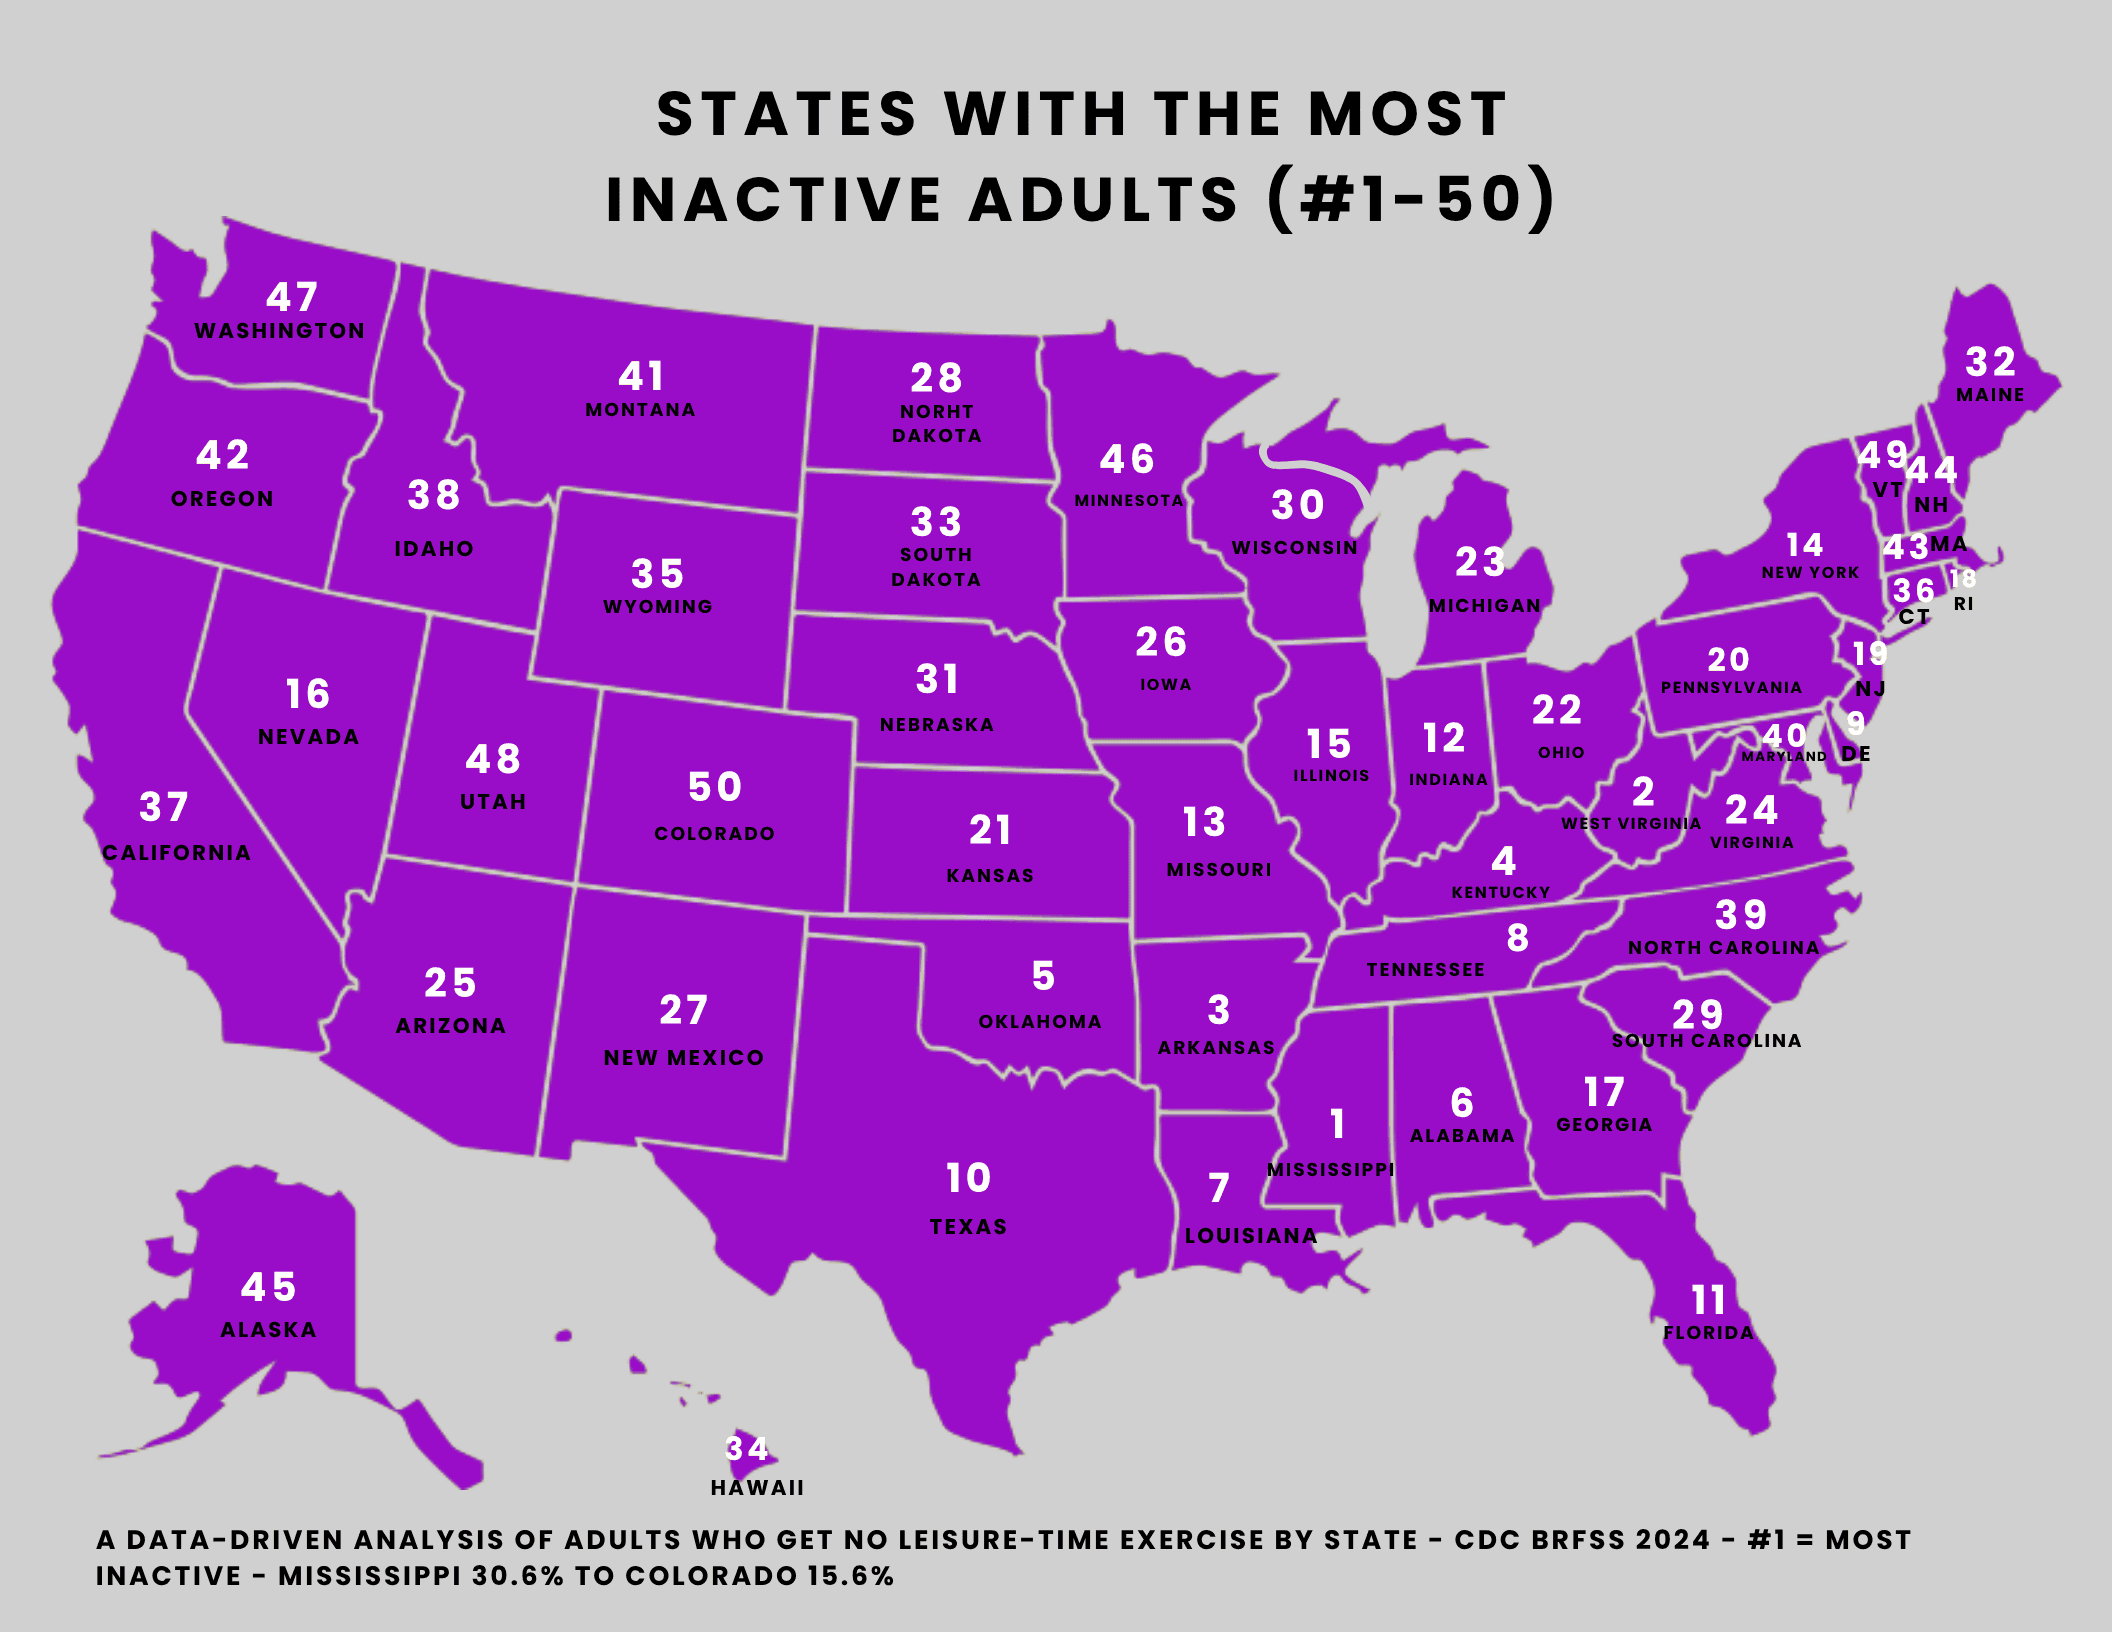
More than 3 in 10 adults in Mississippi (30.6%) report getting no leisure-time physical activity — the highest rate in the country, and nearly double the 15.6% in Colorado, which ranks dead last. That roughly two-to-one spread is wide, but the more striking thing about this map is how *tightly* the top clusters. The most inactive states are concentrated in one corner of the country.
The top of the ranking is a near-solid block of the South and Appalachia: Mississippi leads, followed by West Virginia (28.7%), Arkansas (28.5%), Kentucky (28.0%), and Oklahoma (27.7%), with Tennessee (26.0%) close behind at #8. There's no scattering of high-income outlier states the way some of our other health maps show — inactivity tracks a clean geographic gradient, heaviest across the Mid-South and lightest in the Mountain West and Northeast, where Vermont (16.0%) and Colorado anchor the bottom two spots. When a metric lines up this neatly with region, it usually reflects something structural — climate, terrain, commute and work patterns, the local cost and availability of recreation — rather than individual willpower, though the data here can't prove which.
It's worth being precise about what this measures. The CDC figure captures adults who say they did no leisure-time physical activity in the past month — exercise, sports, gardening, walking for fun. It is self-reported, and it counts only *recreational* movement, so a state's rank reflects how people describe their off-hours, not total daily activity; physically demanding jobs don't register here. Read that way, this is a map of where structured, intentional exercise is least common, which is related to but not the same as where people move the least overall.
The regional story also rhymes with our other maps. West Virginia is the clearest example: it's #2 for inactivity here, but #1 in the country for obesity (41.4%), #1 for adult smoking (20.78%), #1 for arthritis (41.22%), #1 for diabetes (18.36%), #1 for depression (30.22%), and #1 for the worst self-rated health (26.31%). These outcomes plausibly reinforce one another — low activity, higher obesity and diabetes, arthritis that makes movement painful — but they share so many of the same states that it's hard to call any one the cause. Colorado runs the opposite pattern, sitting at #50 for inactivity, obesity (25.0%), *and* diabetes (8.39%).
A note on method: every state here comes from the same CDC survey (BRFSS), one year (2024), one definition, so the 50-state comparison is apples-to-apples. The one exception is Tennessee, shown with its 2023 value, because CDC hadn't released a 2024 figure for it. Ranks are ordinal, with ties broken alphabetically. The numbers are CDC's; the ranking and analysis are ours.
Full ranking — all 50 states
Sort by rank, state, or value. Ranks are ordinal (1 = highest by this metric). Ties are broken alphabetically by state name.
| Note | |||
|---|---|---|---|
| 1st | Mississippi | 30.6% | CDC BRFSS (DNPAO), no leisure-time physical activity (Q047), 2024 |
| 2nd | West Virginia | 28.7% | CDC BRFSS (DNPAO), no leisure-time physical activity (Q047), 2024 |
| 3rd | Arkansas | 28.5% | CDC BRFSS (DNPAO), no leisure-time physical activity (Q047), 2024 |
| 4th | Kentucky | 28% | CDC BRFSS (DNPAO), no leisure-time physical activity (Q047), 2024 |
| 5th | Oklahoma | 27.7% | CDC BRFSS (DNPAO), no leisure-time physical activity (Q047), 2024 |
| 6th | Alabama | 27.6% | CDC BRFSS (DNPAO), no leisure-time physical activity (Q047), 2024 |
| 7th | Louisiana | 27.6% | CDC BRFSS (DNPAO), no leisure-time physical activity (Q047), 2024 |
| 8th | Tennessee | 26% | CDC BRFSS (DNPAO), no leisure-time physical activity (Q047), 2024 (state value is 2023, latest available) |
| 9th | Delaware | 25.2% | CDC BRFSS (DNPAO), no leisure-time physical activity (Q047), 2024 |
| 10th | Texas | 25.1% | CDC BRFSS (DNPAO), no leisure-time physical activity (Q047), 2024 |
| 11th | Florida | 25% | CDC BRFSS (DNPAO), no leisure-time physical activity (Q047), 2024 |
| 12th | Indiana | 24.6% | CDC BRFSS (DNPAO), no leisure-time physical activity (Q047), 2024 |
| 13th | Missouri | 24.6% | CDC BRFSS (DNPAO), no leisure-time physical activity (Q047), 2024 |
| 14th | New York | 24% | CDC BRFSS (DNPAO), no leisure-time physical activity (Q047), 2024 |
| 15th | Illinois | 23.3% | CDC BRFSS (DNPAO), no leisure-time physical activity (Q047), 2024 |
| 16th | Nevada | 23.2% | CDC BRFSS (DNPAO), no leisure-time physical activity (Q047), 2024 |
| 17th | Georgia | 23% | CDC BRFSS (DNPAO), no leisure-time physical activity (Q047), 2024 |
| 18th | Rhode Island | 22.9% | CDC BRFSS (DNPAO), no leisure-time physical activity (Q047), 2024 |
| 19th | New Jersey | 22.8% | CDC BRFSS (DNPAO), no leisure-time physical activity (Q047), 2024 |
| 20th | Pennsylvania | 22.7% | CDC BRFSS (DNPAO), no leisure-time physical activity (Q047), 2024 |
| 21st | Kansas | 22.4% | CDC BRFSS (DNPAO), no leisure-time physical activity (Q047), 2024 |
| 22nd | Ohio | 22.2% | CDC BRFSS (DNPAO), no leisure-time physical activity (Q047), 2024 |
| 23rd | Michigan | 22% | CDC BRFSS (DNPAO), no leisure-time physical activity (Q047), 2024 |
| 24th | Virginia | 21.9% | CDC BRFSS (DNPAO), no leisure-time physical activity (Q047), 2024 |
| 25th | Arizona | 21.8% | CDC BRFSS (DNPAO), no leisure-time physical activity (Q047), 2024 |
| 26th | Iowa | 21.8% | CDC BRFSS (DNPAO), no leisure-time physical activity (Q047), 2024 |
| 27th | New Mexico | 21.7% | CDC BRFSS (DNPAO), no leisure-time physical activity (Q047), 2024 |
| 28th | North Dakota | 21.7% | CDC BRFSS (DNPAO), no leisure-time physical activity (Q047), 2024 |
| 29th | South Carolina | 21.7% | CDC BRFSS (DNPAO), no leisure-time physical activity (Q047), 2024 |
| 30th | Wisconsin | 21.7% | CDC BRFSS (DNPAO), no leisure-time physical activity (Q047), 2024 |
| 31st | Nebraska | 21.6% | CDC BRFSS (DNPAO), no leisure-time physical activity (Q047), 2024 |
| 32nd | Maine | 21.4% | CDC BRFSS (DNPAO), no leisure-time physical activity (Q047), 2024 |
| 33rd | South Dakota | 21.4% | CDC BRFSS (DNPAO), no leisure-time physical activity (Q047), 2024 |
| 34th | Hawaii | 21.3% | CDC BRFSS (DNPAO), no leisure-time physical activity (Q047), 2024 |
| 35th | Wyoming | 21% | CDC BRFSS (DNPAO), no leisure-time physical activity (Q047), 2024 |
| 36th | Connecticut | 20.8% | CDC BRFSS (DNPAO), no leisure-time physical activity (Q047), 2024 |
| 37th | California | 20.7% | CDC BRFSS (DNPAO), no leisure-time physical activity (Q047), 2024 |
| 38th | Idaho | 20.7% | CDC BRFSS (DNPAO), no leisure-time physical activity (Q047), 2024 |
| 39th | North Carolina | 20.2% | CDC BRFSS (DNPAO), no leisure-time physical activity (Q047), 2024 |
| 40th | Maryland | 19.5% | CDC BRFSS (DNPAO), no leisure-time physical activity (Q047), 2024 |
| 41st | Montana | 19.1% | CDC BRFSS (DNPAO), no leisure-time physical activity (Q047), 2024 |
| 42nd | Oregon | 19% | CDC BRFSS (DNPAO), no leisure-time physical activity (Q047), 2024 |
| 43rd | Massachusetts | 18.8% | CDC BRFSS (DNPAO), no leisure-time physical activity (Q047), 2024 |
| 44th | New Hampshire | 18.6% | CDC BRFSS (DNPAO), no leisure-time physical activity (Q047), 2024 |
| 45th | Alaska | 18.1% | CDC BRFSS (DNPAO), no leisure-time physical activity (Q047), 2024 |
| 46th | Minnesota | 17.5% | CDC BRFSS (DNPAO), no leisure-time physical activity (Q047), 2024 |
| 47th | Washington | 17.4% | CDC BRFSS (DNPAO), no leisure-time physical activity (Q047), 2024 |
| 48th | Utah | 16.8% | CDC BRFSS (DNPAO), no leisure-time physical activity (Q047), 2024 |
| 49th | Vermont | 16% | CDC BRFSS (DNPAO), no leisure-time physical activity (Q047), 2024 |
| 50th | Colorado | 15.6% | CDC BRFSS (DNPAO), no leisure-time physical activity (Q047), 2024 |
Per-row source notes (including any single-year exceptions) are shown on wider screens.
Methodology
This map ranks all 50 states by the share of adults who report no leisure-time physical activity — meaning that, outside of their job, they did not exercise or play sports in the past month. The data come from the CDC's Behavioral Risk Factor Surveillance System (BRFSS) via its Nutrition, Physical Activity, and Obesity program (question Q047).
It captures off-the-clock inactivity, not total movement, so physically demanding jobs are not counted — which is part of why inactivity tends to track with other health measures and runs highest across the South. #1 is the most inactive. We use the latest available year per state and disclose any state shown with a prior year on the page (Tennessee uses its 2023 value).
The percentages are CDC's published estimates; the ranking and presentation are ours.
Note: CDC BRFSS (DNPAO), no leisure-time physical activity (Q047), 2024 (state value is 2023, latest available)
Ranks are ordinal (1 = highest by this metric). Ties are broken alphabetically by state name.
Source & data
- Source: CDC Nutrition, Physical Activity & Obesity (DNPAO)Tier 1
- Data period: 2024
- Last updated: June 29, 2026
- Refresh cadence: annual
- #1 (Mississippi): 30.6%
Source: CDC Nutrition, Physical Activity & Obesity (DNPAO)
License: Public domain (U.S. Government work)
By MAP SO HARD
Reviewed by MAP SO HARD editorial