Gas Prices
States with the Most Expensive Gas
#1 = most expensive
- Source
- AAA Fuel Prices
- Period
- 2026-05-28
- Last updated
What the data shows
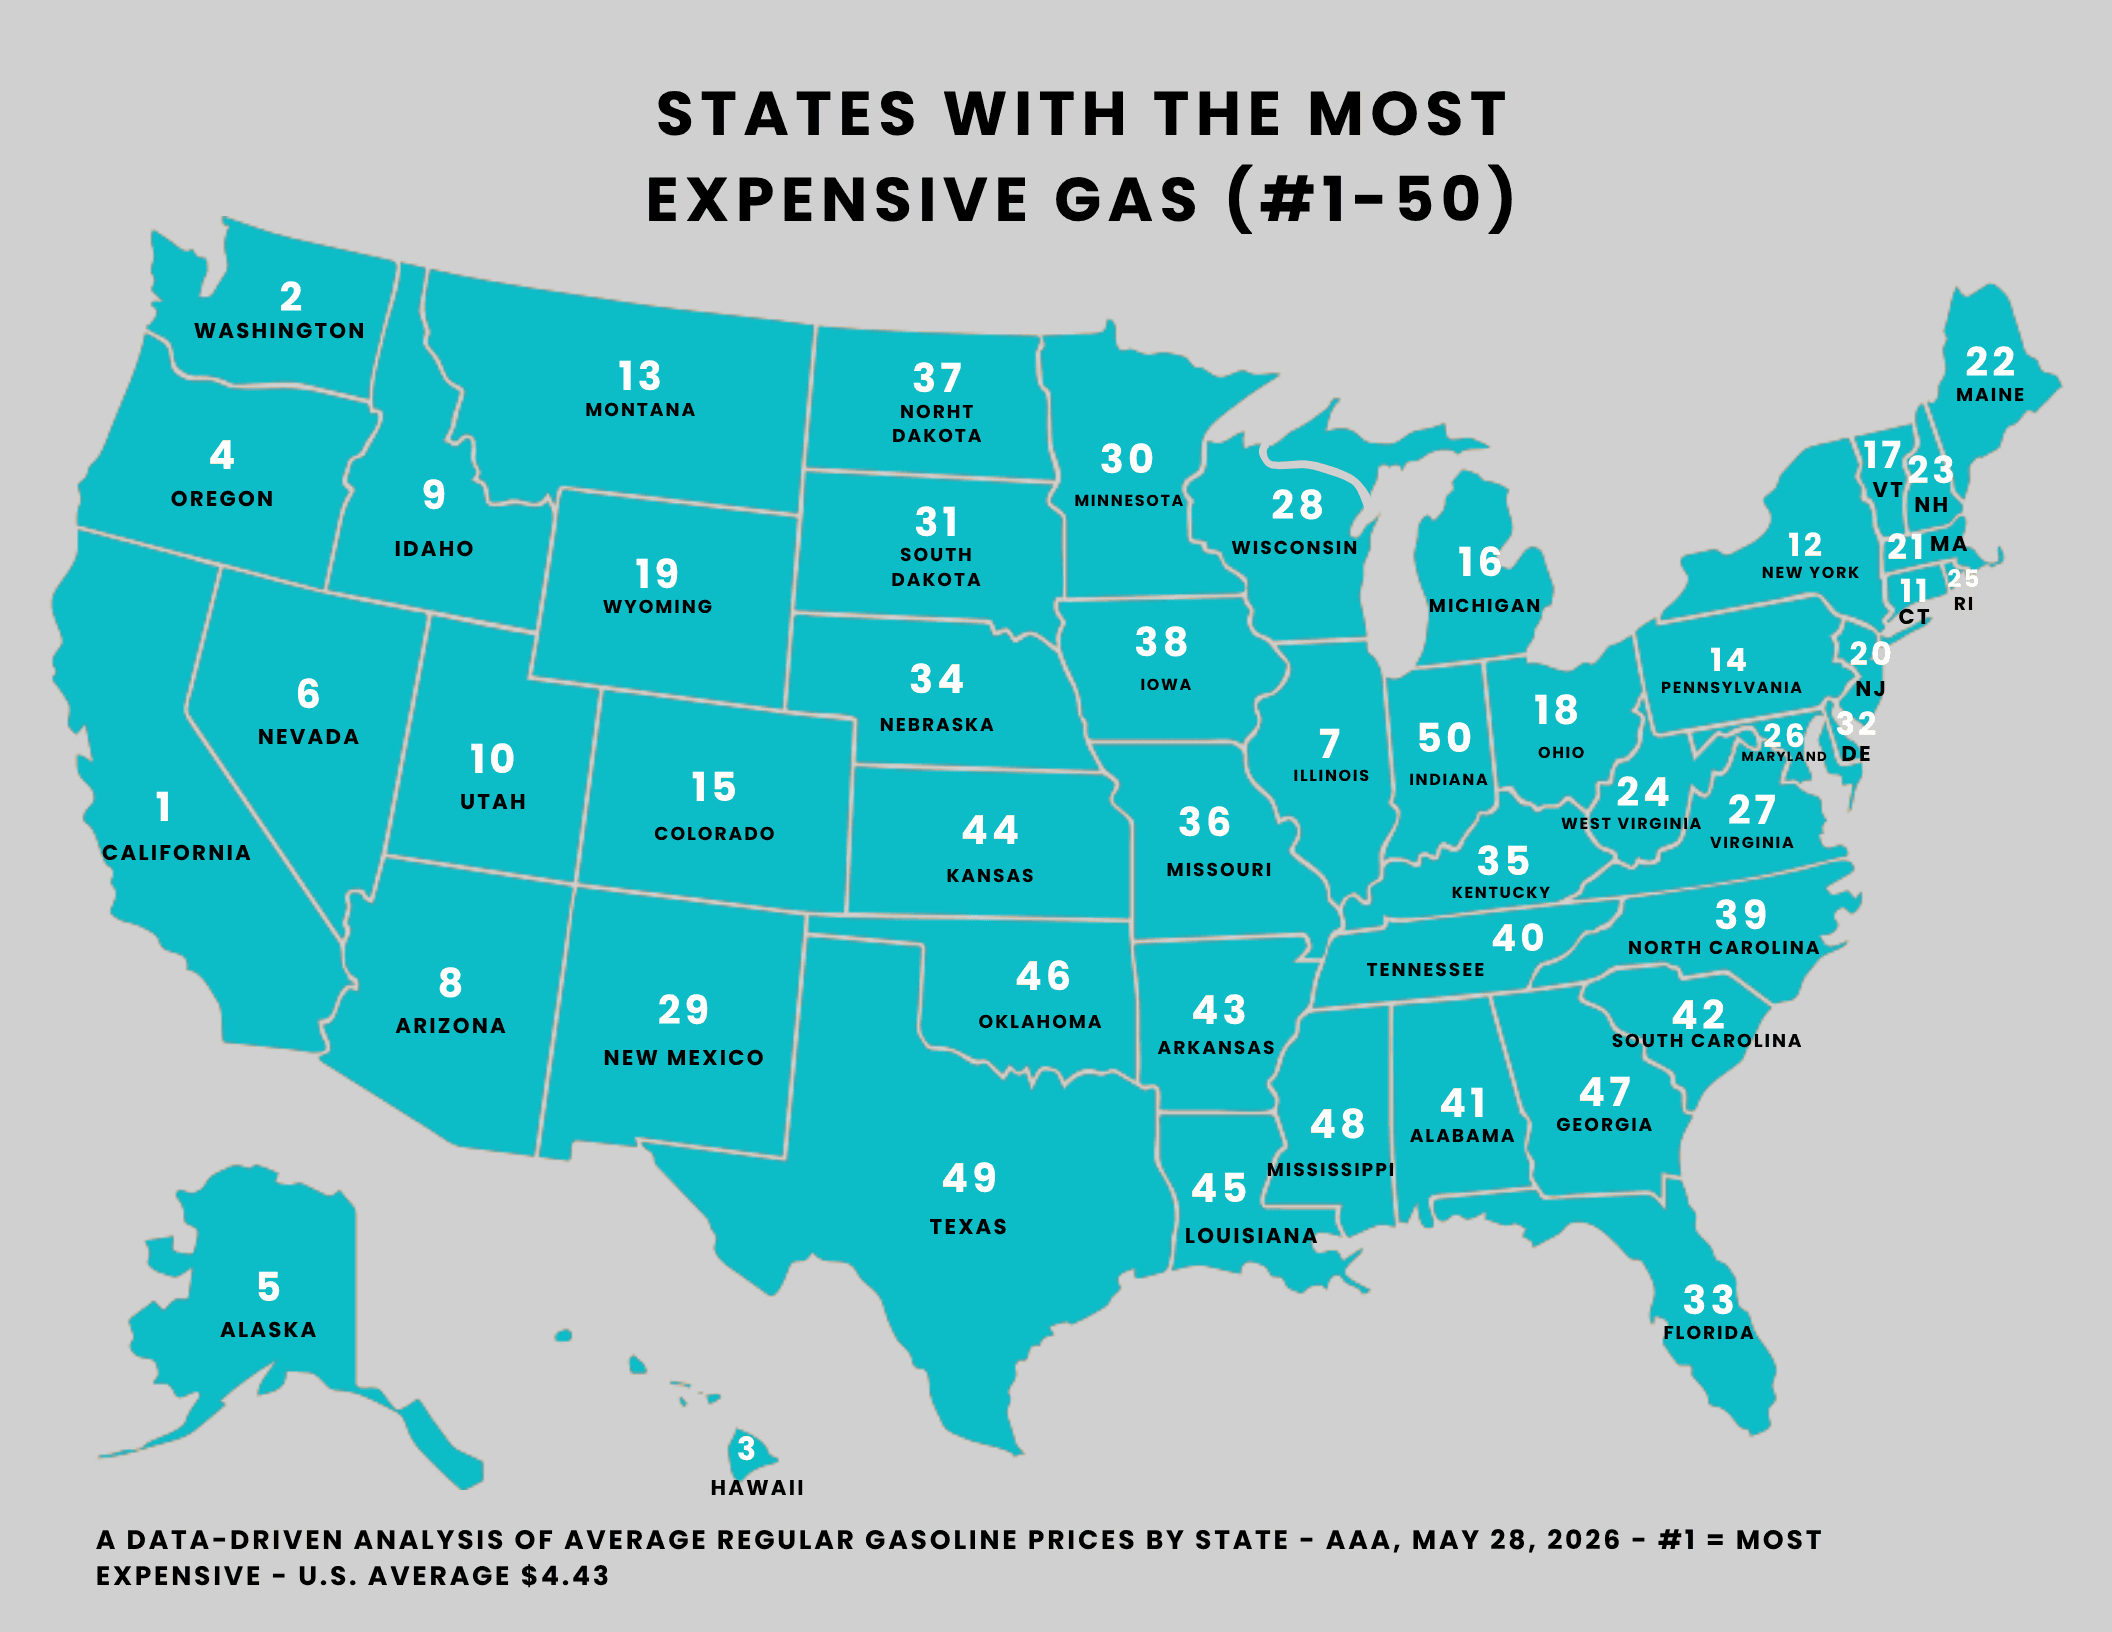
Drivers in California pay $6.08 a gallon for regular gas — the most expensive in the country, and $2.26 more than the cheapest state, Indiana at $3.82. That's a gap of roughly 60% between the top and bottom of the map, one of the widest spreads of any ranking we track. Unlike a health survey, this isn't a number that drifts a few points year to year; it's a daily price that can move with crude oil, but the *ranking* of states tends to be remarkably stable, because most of the spread comes from things that don't change overnight.
The top of the list is almost entirely the West Coast and the Pacific: California (#1), Washington ($5.74), Hawaii ($5.66), Oregon ($5.27), Alaska ($5.26), and Nevada ($5.22) fill out the six most expensive states. Five of those six touch the Pacific, and the clustering is the clearest signal in the data. The bottom is its own region too — Indiana ($3.82), Texas ($3.92), and Mississippi ($3.93) anchor the cheapest end, drawing from the interior and the Gulf Coast, closer to refineries and pipelines.
What this map captures is the retail pump price, not the cost of the gasoline itself. The same gallon of fuel can cost dramatically more depending on where it's sold, and the reasons are mostly structural: state fuel taxes, environmental fuel blends required in some markets, and distance from refining and shipping infrastructure all stack on top of the base commodity price. That's why a state like Hawaii lands near the top — everything has to be shipped in — and it isn't a coincidence that Hawaii also tops our Highest Electric Bills map (#1 at $212/month). Geography and the cost of moving energy around show up in more than one ranking. The honest read is that this is a snapshot of what drivers *actually pay at the pump*, which is shaped as much by policy and logistics as by the price of oil on any given day.
It's worth noting how different this pattern looks from our health maps. There, a small cluster of Appalachian states — led by West Virginia, which is #1 for obesity, smoking, arthritis, depression, diabetes, and worst self-rated health — dominates the top spots. On gas prices, West Virginia is nowhere near the top; the expensive states are coastal and Western. Different forces, different map. The states people argue about for one reason often have nothing to do with the next.
A note on method: every price here comes from the same source, AAA, captured on a single day (2026-05-28), measuring the average retail price of one gallon of regular-grade gasoline — one source, one definition, one snapshot, so the 50-state comparison is apples-to-apples. Because pump prices move daily, this reflects that date and will shift over time, though the broad regional ranking tends to hold. The numbers are AAA's; the ranking and analysis are ours.
Full ranking — all 50 states
Sort by rank, state, or value. Ranks are ordinal (1 = highest by this metric). Ties are broken alphabetically by state name.
| Note | |||
|---|---|---|---|
| 1st | California | $6.08 | AAA daily state average, regular unleaded, 2026-05-28 |
| 2nd | Washington | $5.74 | AAA daily state average, regular unleaded, 2026-05-28 |
| 3rd | Hawaii | $5.66 | AAA daily state average, regular unleaded, 2026-05-28 |
| 4th | Oregon | $5.27 | AAA daily state average, regular unleaded, 2026-05-28 |
| 5th | Alaska | $5.26 | AAA daily state average, regular unleaded, 2026-05-28 |
| 6th | Nevada | $5.22 | AAA daily state average, regular unleaded, 2026-05-28 |
| 7th | Illinois | $4.87 | AAA daily state average, regular unleaded, 2026-05-28 |
| 8th | Arizona | $4.74 | AAA daily state average, regular unleaded, 2026-05-28 |
| 9th | Idaho | $4.66 | AAA daily state average, regular unleaded, 2026-05-28 |
| 10th | Utah | $4.63 | AAA daily state average, regular unleaded, 2026-05-28 |
| 11th | Connecticut | $4.59 | AAA daily state average, regular unleaded, 2026-05-28 |
| 12th | New York | $4.57 | AAA daily state average, regular unleaded, 2026-05-28 |
| 13th | Montana | $4.56 | AAA daily state average, regular unleaded, 2026-05-28 |
| 14th | Pennsylvania | $4.56 | AAA daily state average, regular unleaded, 2026-05-28 |
| 15th | Colorado | $4.53 | AAA daily state average, regular unleaded, 2026-05-28 |
| 16th | Michigan | $4.52 | AAA daily state average, regular unleaded, 2026-05-28 |
| 17th | Vermont | $4.51 | AAA daily state average, regular unleaded, 2026-05-28 |
| 18th | Ohio | $4.51 | AAA daily state average, regular unleaded, 2026-05-28 |
| 19th | Wyoming | $4.5 | AAA daily state average, regular unleaded, 2026-05-28 |
| 20th | New Jersey | $4.46 | AAA daily state average, regular unleaded, 2026-05-28 |
| 21st | Massachusetts | $4.45 | AAA daily state average, regular unleaded, 2026-05-28 |
| 22nd | Maine | $4.45 | AAA daily state average, regular unleaded, 2026-05-28 |
| 23rd | New Hampshire | $4.43 | AAA daily state average, regular unleaded, 2026-05-28 |
| 24th | West Virginia | $4.42 | AAA daily state average, regular unleaded, 2026-05-28 |
| 25th | Rhode Island | $4.4 | AAA daily state average, regular unleaded, 2026-05-28 |
| 26th | Maryland | $4.29 | AAA daily state average, regular unleaded, 2026-05-28 |
| 27th | Virginia | $4.29 | AAA daily state average, regular unleaded, 2026-05-28 |
| 28th | Wisconsin | $4.29 | AAA daily state average, regular unleaded, 2026-05-28 |
| 29th | New Mexico | $4.25 | AAA daily state average, regular unleaded, 2026-05-28 |
| 30th | Minnesota | $4.24 | AAA daily state average, regular unleaded, 2026-05-28 |
| 31st | South Dakota | $4.24 | AAA daily state average, regular unleaded, 2026-05-28 |
| 32nd | Delaware | $4.23 | AAA daily state average, regular unleaded, 2026-05-28 |
| 33rd | Florida | $4.21 | AAA daily state average, regular unleaded, 2026-05-28 |
| 34th | Nebraska | $4.2 | AAA daily state average, regular unleaded, 2026-05-28 |
| 35th | Kentucky | $4.17 | AAA daily state average, regular unleaded, 2026-05-28 |
| 36th | Missouri | $4.11 | AAA daily state average, regular unleaded, 2026-05-28 |
| 37th | North Dakota | $4.08 | AAA daily state average, regular unleaded, 2026-05-28 |
| 38th | Iowa | $4.08 | AAA daily state average, regular unleaded, 2026-05-28 |
| 39th | North Carolina | $4.07 | AAA daily state average, regular unleaded, 2026-05-28 |
| 40th | Tennessee | $4.06 | AAA daily state average, regular unleaded, 2026-05-28 |
| 41st | Alabama | $4.05 | AAA daily state average, regular unleaded, 2026-05-28 |
| 42nd | South Carolina | $4.03 | AAA daily state average, regular unleaded, 2026-05-28 |
| 43rd | Arkansas | $4.02 | AAA daily state average, regular unleaded, 2026-05-28 |
| 44th | Kansas | $4.01 | AAA daily state average, regular unleaded, 2026-05-28 |
| 45th | Louisiana | $3.95 | AAA daily state average, regular unleaded, 2026-05-28 |
| 46th | Oklahoma | $3.94 | AAA daily state average, regular unleaded, 2026-05-28 |
| 47th | Georgia | $3.93 | AAA daily state average, regular unleaded, 2026-05-28 |
| 48th | Mississippi | $3.93 | AAA daily state average, regular unleaded, 2026-05-28 |
| 49th | Texas | $3.92 | AAA daily state average, regular unleaded, 2026-05-28 |
| 50th | Indiana | $3.82 | AAA daily state average, regular unleaded, 2026-05-28 |
Per-row source notes (including any single-year exceptions) are shown on wider screens.
Methodology
This map ranks all 50 states by the average price of a gallon of regular unleaded gasoline, as reported by AAA. AAA publishes daily state-level averages compiled from fuel-price data across stations nationwide, which makes it the de-facto standard for an all-50-state daily comparison.
Each state shows its average price for the data date noted on the page; #1 is the most expensive. Prices move daily with crude oil costs, state fuel taxes, regional refining and supply, and seasonal blend requirements — which is why high-tax, supply-constrained states (like California) consistently sit near the top and why this map carries a specific date rather than a year.
Figures are AAA's published state averages, reproduced as attributed facts with our own ranking and presentation; we do not alter the underlying numbers.
Ranks are ordinal (1 = highest by this metric). Ties are broken alphabetically by state name.
Source & data
- Source: AAA Fuel PricesTier 2
- Data period: 2026-05-28
- Last updated: June 29, 2026
- Refresh cadence: annual
- #1 (California): $6.08/gal
Gas prices: AAA (gasprices.aaa.com)
By MAP SO HARD
Reviewed by MAP SO HARD editorial