Obesity
States with the Highest Obesity Rates
#1 = most obese
- Period
- 2024
- Last updated
What the data shows
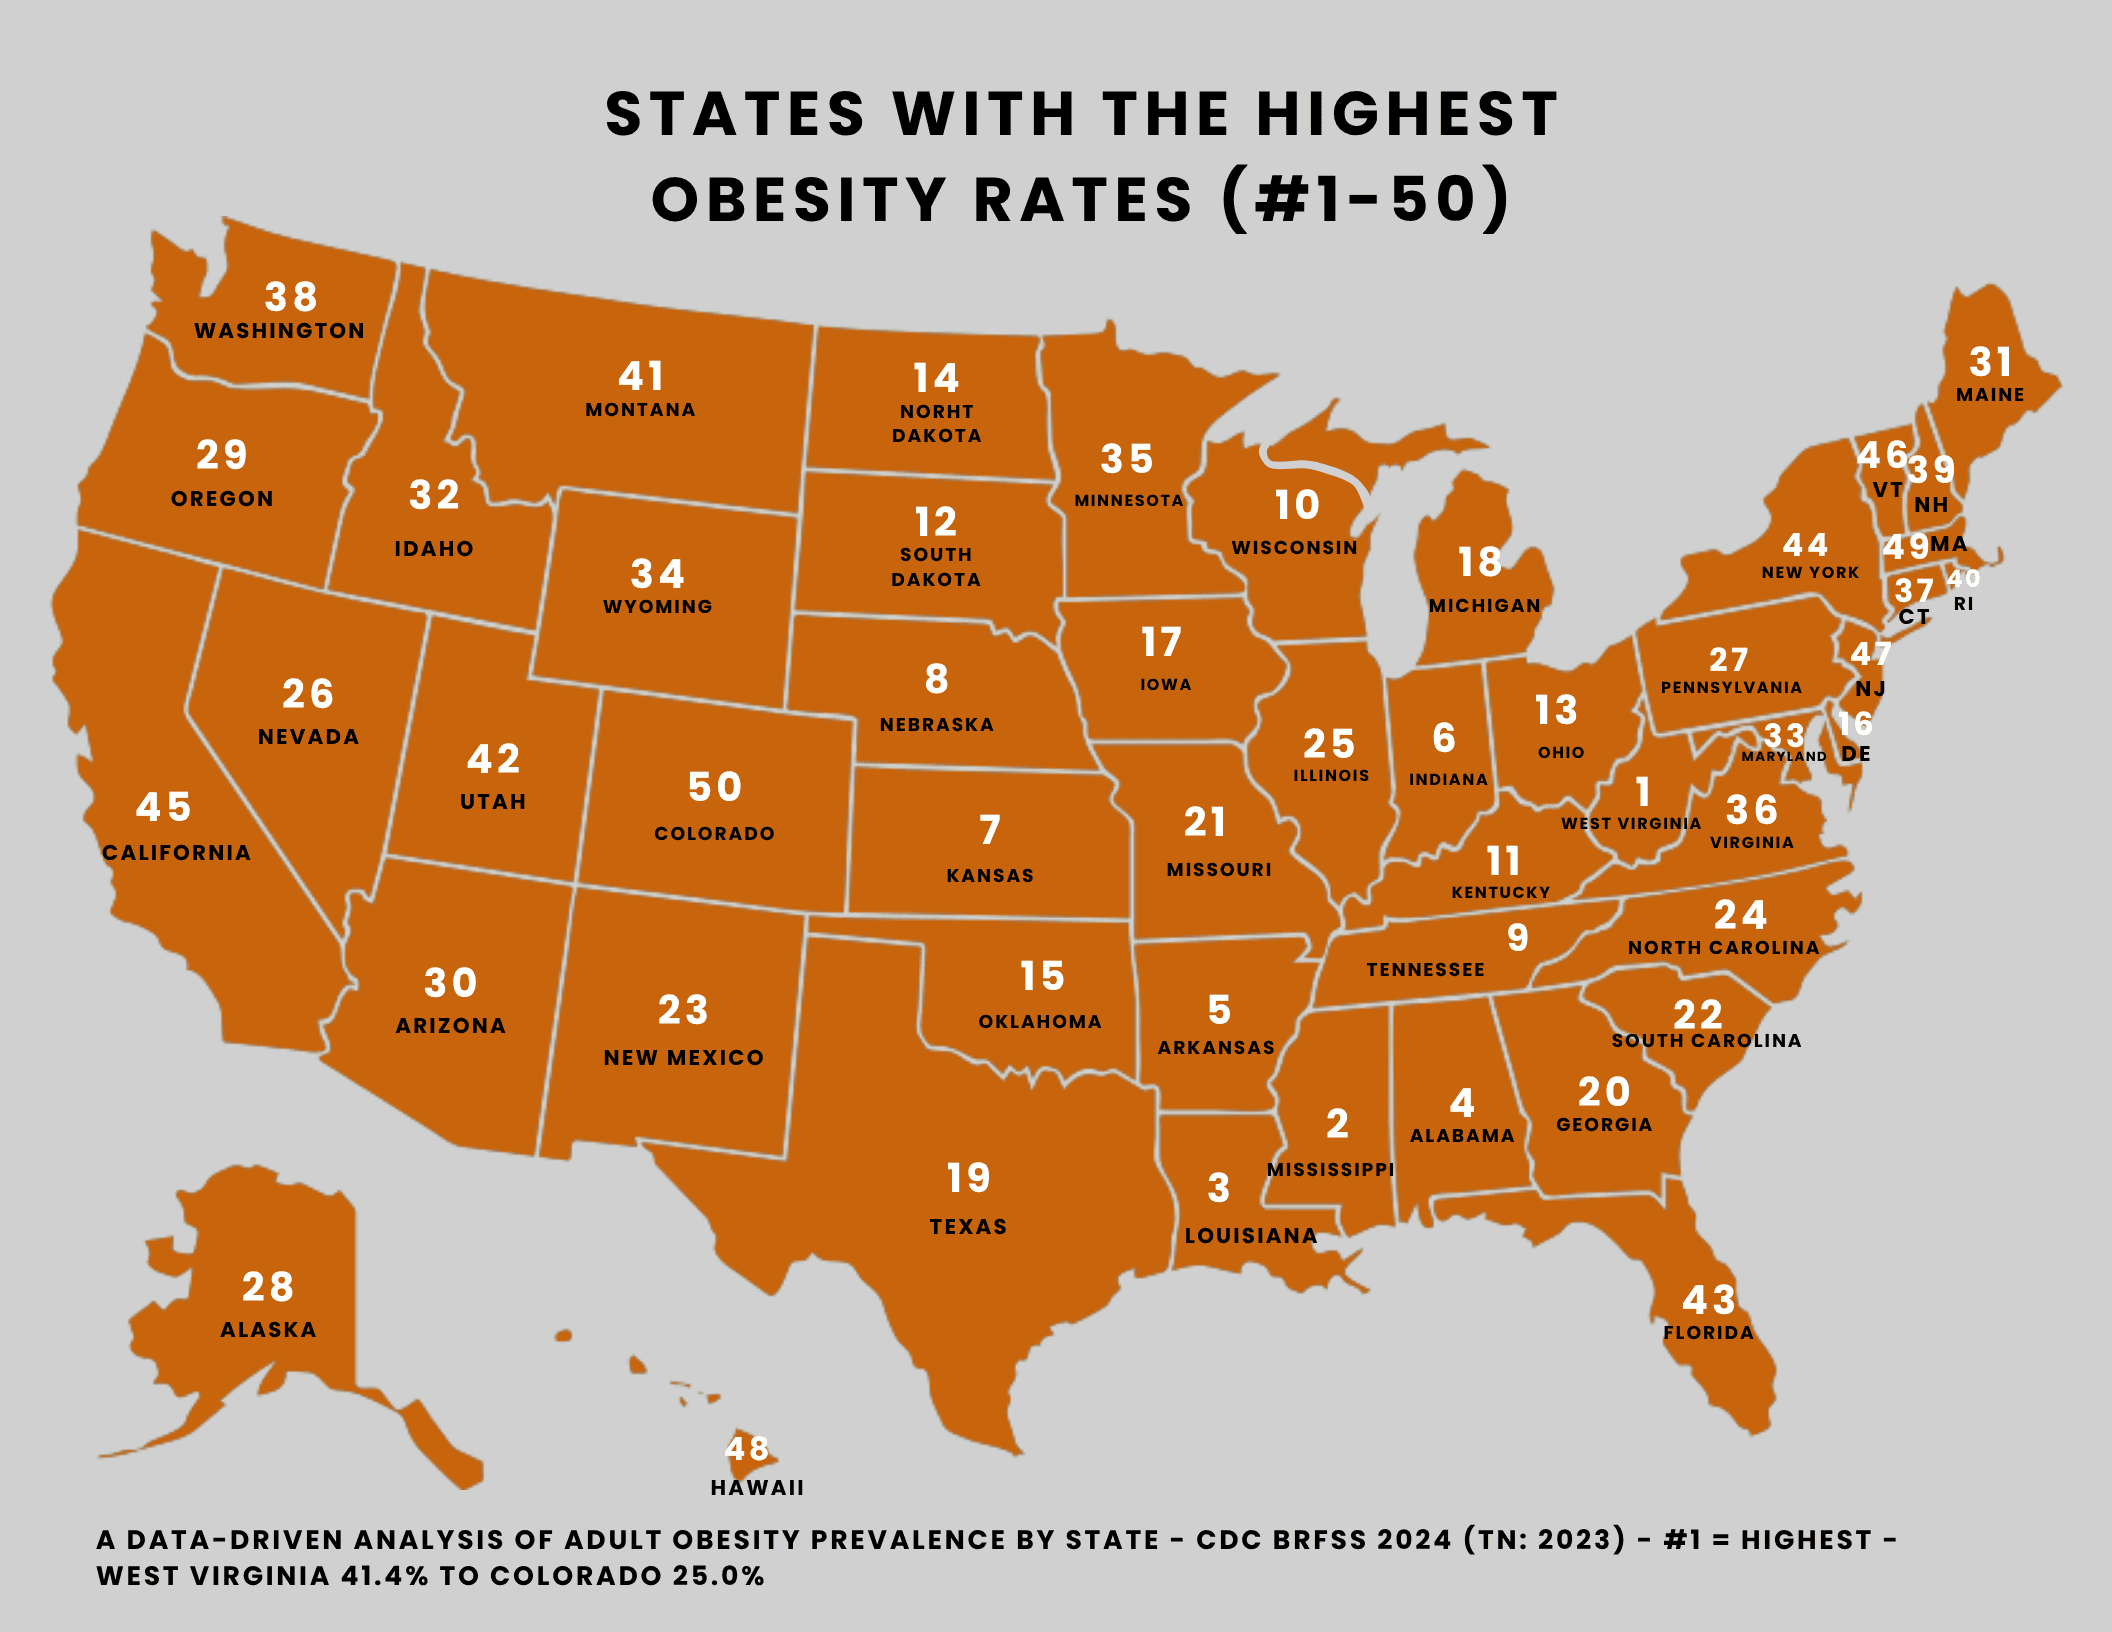
About 4 in 10 adults in West Virginia (41.4%) are obese — the highest rate in the country, and far above the 25.0% in Colorado, which ranks last. That's a 16-point spread between first and last, and unlike depression or asthma, the states at the top here form one of the tightest, most legible regions on any of our maps.
The top of this ranking is almost entirely the Deep South and Appalachia. West Virginia leads, with Mississippi (40.4%), Louisiana (39.2%), Alabama (38.9%), and Arkansas (38.9%) filling out the next four spots, and Indiana (38.4%) and Tennessee (37.6%) close behind. There's no scattering of high-income coastal states breaking up the pattern the way there is on some of our other health maps — the obesity belt is a contiguous block running across the Gulf states and up into the Ohio Valley. At the other end sit Colorado (25.0%), Massachusetts (27.0%), and Hawaii (27.0%), and even there the "lowest" obesity rate in America is one in four adults — a reminder that this is a nationwide condition, not a regional one. The gap between states is real, but the floor is already high.
Unlike some of our maps, the metric here is fairly direct. This is self-reported height and weight from the CDC's survey, converted to a body-mass-index threshold (BMI of 30 or higher). Self-reporting tends to *understate* obesity — people round their weight down and their height up — so the true rates are likely a bit higher than every number on this map, fairly uniformly across states. That makes the *ranking* trustworthy even if the absolute levels run conservative: the ordering of states is on solid ground, and the regional pattern isn't an artifact of who gets diagnosed, the way it can be for conditions that require a doctor's visit.
What's striking is how often the same names recur. West Virginia isn't only #1 for obesity — across our other CDC maps it's also #1 for adult smokers (20.78%), #1 for arthritis (41.22%), #1 for diabetes (18.36%), #1 for depression (30.22%), and #1 for the worst self-rated health (26.31%). And the inactivity map tells a closely related story: Mississippi is #1 for inactive adults (30.6%) — and it sits at #2 here — while Colorado ranks #50 (15.6%), the very same state that anchors the bottom of this map at #50. Obesity, inactivity, and chronic disease cluster together state by state, and a small group of Appalachian and Deep South states keeps landing at the top of ranking after ranking.
A note on method: every state here comes from the same CDC survey (BRFSS), one year (2024), one definition, so the 50-state comparison is apples-to-apples. The one exception is Tennessee, shown with its 2023 value (37.6%), because CDC hadn't released a 2024 figure for it; it's flagged on the map. The numbers are CDC's; the ranking and analysis are ours.
Full ranking — all 50 states
Sort by rank, state, or value. Ranks are ordinal (1 = highest by this metric). Ties are broken alphabetically by state name.
| Note | |||
|---|---|---|---|
| 1st | West Virginia | 41.4% | CDC BRFSS (DNPAO), adult obesity BMI>=30 (Q036), 2024 |
| 2nd | Mississippi | 40.4% | CDC BRFSS (DNPAO), adult obesity BMI>=30 (Q036), 2024 |
| 3rd | Louisiana | 39.2% | CDC BRFSS (DNPAO), adult obesity BMI>=30 (Q036), 2024 |
| 4th | Alabama | 38.9% | CDC BRFSS (DNPAO), adult obesity BMI>=30 (Q036), 2024 |
| 5th | Arkansas | 38.9% | CDC BRFSS (DNPAO), adult obesity BMI>=30 (Q036), 2024 |
| 6th | Indiana | 38.4% | CDC BRFSS (DNPAO), adult obesity BMI>=30 (Q036), 2024 |
| 7th | Kansas | 37.6% | CDC BRFSS (DNPAO), adult obesity BMI>=30 (Q036), 2024 |
| 8th | Nebraska | 37.6% | CDC BRFSS (DNPAO), adult obesity BMI>=30 (Q036), 2024 |
| 9th | Tennessee | 37.6% | CDC BRFSS (DNPAO), adult obesity BMI>=30 (Q036), 2024 (state value is 2023, latest available) |
| 10th | Wisconsin | 37.4% | CDC BRFSS (DNPAO), adult obesity BMI>=30 (Q036), 2024 |
| 11th | Kentucky | 37.2% | CDC BRFSS (DNPAO), adult obesity BMI>=30 (Q036), 2024 |
| 12th | South Dakota | 37% | CDC BRFSS (DNPAO), adult obesity BMI>=30 (Q036), 2024 |
| 13th | Ohio | 36.9% | CDC BRFSS (DNPAO), adult obesity BMI>=30 (Q036), 2024 |
| 14th | North Dakota | 36.8% | CDC BRFSS (DNPAO), adult obesity BMI>=30 (Q036), 2024 |
| 15th | Oklahoma | 36.8% | CDC BRFSS (DNPAO), adult obesity BMI>=30 (Q036), 2024 |
| 16th | Delaware | 36.6% | CDC BRFSS (DNPAO), adult obesity BMI>=30 (Q036), 2024 |
| 17th | Iowa | 36.6% | CDC BRFSS (DNPAO), adult obesity BMI>=30 (Q036), 2024 |
| 18th | Michigan | 36.1% | CDC BRFSS (DNPAO), adult obesity BMI>=30 (Q036), 2024 |
| 19th | Texas | 35.6% | CDC BRFSS (DNPAO), adult obesity BMI>=30 (Q036), 2024 |
| 20th | Georgia | 35.4% | CDC BRFSS (DNPAO), adult obesity BMI>=30 (Q036), 2024 |
| 21st | Missouri | 34.6% | CDC BRFSS (DNPAO), adult obesity BMI>=30 (Q036), 2024 |
| 22nd | South Carolina | 34.6% | CDC BRFSS (DNPAO), adult obesity BMI>=30 (Q036), 2024 |
| 23rd | New Mexico | 34.5% | CDC BRFSS (DNPAO), adult obesity BMI>=30 (Q036), 2024 |
| 24th | North Carolina | 34.5% | CDC BRFSS (DNPAO), adult obesity BMI>=30 (Q036), 2024 |
| 25th | Illinois | 34.2% | CDC BRFSS (DNPAO), adult obesity BMI>=30 (Q036), 2024 |
| 26th | Nevada | 34.2% | CDC BRFSS (DNPAO), adult obesity BMI>=30 (Q036), 2024 |
| 27th | Pennsylvania | 34.2% | CDC BRFSS (DNPAO), adult obesity BMI>=30 (Q036), 2024 |
| 28th | Alaska | 34% | CDC BRFSS (DNPAO), adult obesity BMI>=30 (Q036), 2024 |
| 29th | Oregon | 33.5% | CDC BRFSS (DNPAO), adult obesity BMI>=30 (Q036), 2024 |
| 30th | Arizona | 33.3% | CDC BRFSS (DNPAO), adult obesity BMI>=30 (Q036), 2024 |
| 31st | Maine | 33.2% | CDC BRFSS (DNPAO), adult obesity BMI>=30 (Q036), 2024 |
| 32nd | Idaho | 32.7% | CDC BRFSS (DNPAO), adult obesity BMI>=30 (Q036), 2024 |
| 33rd | Maryland | 32.7% | CDC BRFSS (DNPAO), adult obesity BMI>=30 (Q036), 2024 |
| 34th | Wyoming | 32.5% | CDC BRFSS (DNPAO), adult obesity BMI>=30 (Q036), 2024 |
| 35th | Minnesota | 32.3% | CDC BRFSS (DNPAO), adult obesity BMI>=30 (Q036), 2024 |
| 36th | Virginia | 32.3% | CDC BRFSS (DNPAO), adult obesity BMI>=30 (Q036), 2024 |
| 37th | Connecticut | 32% | CDC BRFSS (DNPAO), adult obesity BMI>=30 (Q036), 2024 |
| 38th | Washington | 31.5% | CDC BRFSS (DNPAO), adult obesity BMI>=30 (Q036), 2024 |
| 39th | New Hampshire | 31.1% | CDC BRFSS (DNPAO), adult obesity BMI>=30 (Q036), 2024 |
| 40th | Rhode Island | 31.1% | CDC BRFSS (DNPAO), adult obesity BMI>=30 (Q036), 2024 |
| 41st | Montana | 31% | CDC BRFSS (DNPAO), adult obesity BMI>=30 (Q036), 2024 |
| 42nd | Utah | 31% | CDC BRFSS (DNPAO), adult obesity BMI>=30 (Q036), 2024 |
| 43rd | Florida | 29.6% | CDC BRFSS (DNPAO), adult obesity BMI>=30 (Q036), 2024 |
| 44th | New York | 29.5% | CDC BRFSS (DNPAO), adult obesity BMI>=30 (Q036), 2024 |
| 45th | California | 29.1% | CDC BRFSS (DNPAO), adult obesity BMI>=30 (Q036), 2024 |
| 46th | Vermont | 29% | CDC BRFSS (DNPAO), adult obesity BMI>=30 (Q036), 2024 |
| 47th | New Jersey | 27.7% | CDC BRFSS (DNPAO), adult obesity BMI>=30 (Q036), 2024 |
| 48th | Hawaii | 27% | CDC BRFSS (DNPAO), adult obesity BMI>=30 (Q036), 2024 |
| 49th | Massachusetts | 27% | CDC BRFSS (DNPAO), adult obesity BMI>=30 (Q036), 2024 |
| 50th | Colorado | 25% | CDC BRFSS (DNPAO), adult obesity BMI>=30 (Q036), 2024 |
Per-row source notes (including any single-year exceptions) are shown on wider screens.
Methodology
This map ranks all 50 states by the share of adults with obesity, defined as a body mass index (BMI) of 30 or higher. The data come from the CDC's Behavioral Risk Factor Surveillance System (BRFSS), the long-running, state-representative telephone survey of U.S. adults, via its Nutrition, Physical Activity, and Obesity program (question Q036).
Values are self-reported height and weight, which research shows can slightly understate true obesity, but BRFSS applies a consistent methodology across every state, so the state-to-state comparison is sound. #1 is the highest obesity rate. We use the most recent year available for each state; where a state has no value for the latest year, we use its most recent prior year and disclose it on the page (Tennessee uses its 2023 value).
The ranking and presentation are ours; the percentages are CDC's published estimates, shown with their source and year.
Note: CDC BRFSS (DNPAO), adult obesity BMI>=30 (Q036), 2024 (state value is 2023, latest available)
Ranks are ordinal (1 = highest by this metric). Ties are broken alphabetically by state name.
Source & data
- Source: CDC Nutrition, Physical Activity & Obesity (DNPAO)Tier 1
- Data period: 2024
- Last updated: June 29, 2026
- Refresh cadence: annual
- #1 (West Virginia): 41.4%
Source: CDC Nutrition, Physical Activity & Obesity (DNPAO)
License: Public domain (U.S. Government work)
By MAP SO HARD
Reviewed by MAP SO HARD editorial